WHERE TO BUY
ASBIS supplies a wide range of IT products to its customers all over UAE. To find out retail store near you visit ASBIS Resellers section
Other headlines

ASBIS Group in Q4 2013: own brands sales at all-time high improve profitability. Y2013 net profit forecast exceeded.
ASBISc Enterprises Plc, a leading distributor of IT products in emerging markets of Europe, the Middle East and Africa, has reported a successful Q4 2013. In the period, the Company continued focusing on improving its cash flows, gross profit margins and profitability, by refining its product portfolio and increasing sales of own brands. For 2013, the Company posted revenues of USD 1.92bn, with net profit exceeding USD 12.71m.

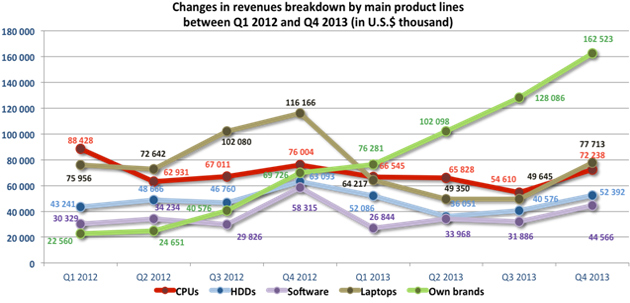
In Q4 2013 sales of two ASBIS own brands, Prestigio and Canyon, hit a new historical high of USD 162.5m, an increase of 133.09% year on year. This drove own brands sales in 2013 to almost USD 469m, a three-fold improvement on 2012. Sales of own brands accounted for 24.42% of total sales in 2013 (relative to 9.03% in 2012), and 28.33% in Q4 2013 (relative to 12.31% in Q4 2012). This improved gross profit margins from 5.12% in Q4 2012 to 6.21% in Q4 2013 and from 4.95% in 2012 to 6.02% in 2013. As a result, while revenues grew by 1.29% in Q4 2013 and by 10.06% in the twelve months of 2013, profitability growth was substantially higher.
In Q4 2013, the gross profit increased by 22.79%, to USD 35.643m, from USD 29.027m in Q4 2012. The twelve-month gross profit reached USD 115.571m, relative to USD 86.327m in 2012, an increase of 33.88%. Over the same periods, EBITDA grew 30.57% for the quarter and 50.95% for the twelve months, and for the whole year it amounted to USD 34.840m, compared with 23.082m in 2012.
As a result, the Company achieved its financial targets and exceeded its net profit forecast after tax: it had forecast NPAT between USD 11.0m and USD 12.5m, while the actual figure was USD 12.712m, a 40.51% increase on Y2012.
Siarhei Kostevitch, CEO and Chairman of ASBISc Enterprises Plc, commented: “We consider both Q4 2013 and the whole year to have been successful, especially since we were able to make such significant changes to our business. We are no longer a simple distribution company – now we are firmly standing on two legs, using our well-developed distribution network to also sell our own brands. This has allowed us to improve our gross profit margins and the overall profitability of the Company. Our 2013 financial results confirm that our strategy of focusing more on high margin products (both own and third party brands) was right. We will continue pursuing this strategy to deliver further growth in 2014.”
“Another achievement in 2013 is the improvement of our cash flows”, Kostevitch continued. “This was a tough exercise, since at the same time we had to finance a fast-growing own-brands business. However, ultimately we delivered a three-fold growth in the own brands business as well as a more than 40% higher net profit after tax. We also improved cash flows from operations, by USD 49m, turning it into about USD 11m positive compared to USD 38m negative in 2012. Our next objective is to further improve revenues, especially from own brands and further improve cash from operations. We now expect to benefit from our strong market position and further development of our own brands, and deliver even more robust results in 2014.”
Financial results in Q4 2013 and Q4 2012
(USD ’000)
| Q4 2013 | Q4 2012 | Change | |
| Revenues | 573,706 | 566,397 | +1.29% |
| Gross profit | 35,643 | 29,027 | +22.79% |
Gross profit margin | 6.21% | 5.12% | +21.23% |
Administrative expenses | 8,375 | 6,721 | +24.60% |
Selling expenses | 16,062 | 13,737 | +16.93% |
Operating profit | 11,206 | 8,569 | +30.78% |
| EBITDA | 12,083 | 9,254 | +30.57% |
| Net profit | 4,953 | 4,442 | +11.52% |
Financial results in Q1-Q4 2013 and Q1-Q4 2012 (USD ’000)
| Q1-Q4 2013 | Q1-Q4 2012 | Change | |
| Revenues | 1,920,427 | 1,744,878 | +10.06% |
| Gross profit | 115,571 | 86,327 | +33.88% |
Gross profit margin | 6.02% | 4.95% | +21.64% |
Administrative expenses | 29,982 | 23,916 | +25.36% |
Selling expenses | 53,651 | 41,332 | +29.81% |
Operating profit | 31,939 | 21,079 | +51.52% |
| EBITDA | 34,840 | 23,082 | +50.95% |
| Net profit | 12,712 | 9,047 | +40.51% |
Financial forecast for 2013 exceeded, growth planned for 2014
For 2013, ASBIS forecast revenues between USD 1.85 billion and USD 1.95 billion and NPAT from USD 11.0 million to USD 12.5 million. With USD 1.920 billion we came close to the upper limit of the revenues forecast, while the USD 12.712 million net profit exceeded it. With these positive developments in 2013, ASBIS expects further growth in 2014.

Detailed sales profile
The most important development in Q4 2013 and throughout 2013 was the strong increase in sales of our own brands and their contribution to total revenues.
- In Q4 2013, revenues from own brands grew by 133.09% to a new historical record of USD 162,523m (more than for the full year 2012), compared to USD 69,726m in Q4 2012. Own brands’ contribution to total revenues was 28.33%, compared with 12.31% in Q4 2012.
- In Q1-Q4 2013, revenues from own brands grew by 197.60% to a new historical record of USD 468,988m, compared with USD 157,590m in Q1-Q4 2012. Own brands’ contribution to total revenues was 24.42% in 2013, compared with 9.03% in 2012.

We also significantly increased sales in the booming tablet and smartphone segments:
- In Q4 2013, revenues from the sale of tablets increased by 98.76% to USD 110,654m from USD 55,672m in the corresponding period of 2012. This was mostly due to significantly higher unit sales. For the full year 2013, revenues grew by 172.37%, to USD 334,444m from USD 122,786m in 2012.
- In Q4 2013, revenues from the sale of smartphones increased by 25.84% to USD 79,016m from USD 62,789m in the corresponding period of 2012. This was again mostly due to significantly higher unit sales. For the full year 2013, revenues grew by 141.93% to USD 357,126m from USD 147,614m in 2012.
Revenue breakdown by regions in Q4 2013 and Q4 2012 (USD ’000):
| Region | Q4 2013 | Q4 2012 | Change % |
| Central & Eastern Europe and Baltic States | 244,410 | 205,280 | +19.06% |
| Former Soviet Union | 233,241 | 224,619 | +3.84% |
| Middle East and Africa | 51,423 | 58,466 | -12,05% |
| Western Europe | 35,537 | 60,583 | -41.34% |
| Other | 9,095 | 17,448 | -47.87% |
| Total | 573,706 | 566,397 | +1.29% |
Revenue breakdown by regions in Q1-Q4 2013 and Q1-Q4 2012 (USD ’000):
| Region | Q1-Q4 2013 | Q1-Q4 2012 | Change % |
| Central & Eastern Europe and Baltic States | 741,549 | 607,563 | +22.05% |
| Former Soviet Union | 730,683 | 705,191 | +3.61% |
| Middle East and Africa | 231,997 | 230,302 | +0.74% |
| Western Europe | 181,659 | 145,033 | +25.25% |
| Other | 34,540 | 56,789 | -39.18% |
| Total | 1,920,427 | 1,744,878 | +10.06% |
Revenue breakdown in Q4 2013 and Q4 2012 – Top 10 countries (USD ’000)
| Q4 2013 | Q4 2012 | |||
| Country | Sales | Country | Sales | |
| 1. | Russia | 124,806 | Russia | 132,881 |
| 2. | Slovakia | 100,853 | Slovakia | 66,449 |
| 3. | Ukraine | 59,032 | Ukraine | 50,265 |
| 4. | Czech Republic | 36,587 | Bulgaria | 29,504 |
| 5. | United Arab Emirates | 34,482 | United Arab Emirates | 28,485 |
| 6. | Bulgaria | 30,069 | United Kingdom | 24,984 |
| 7. | Belarus | 27,181 | Czech Republic | 24,554 |
| 8. | Kazakhstan | 18,709 | Belarus | 20,516 |
| 9. | Romania | 16,411 | Kazakhstan | 16,495 |
| 10. | Poland | 10,928 | Lithuania | 15,176 |
| 11. | Other | 114,651 | Other | 157,089 |
Total revenue | 573,706 | Total revenue | 566,397 | |
Revenue breakdown iN Q1-Q4 2013 and Q1-Q4 2012 – Top 10 countries (USD ’000)
| Q1-Q4 2013 | Q1-Q4 2012 | |||
| Country | Sales | Country | Sales | |
| 1. | Russia | 410,880 | Russia | 403,488 |
| 2. | Slovakia | 221,242 | Slovakia | 174,827 |
| 3. | Ukraine | 163,699 | Ukraine | 167,249 |
| 4. | United Arab Emirates | 139,252 | United Arab Emirates | 125,588 |
| 5. | Bulgaria | 107,690 | Bulgaria | 82,813 |
| 6. | Czech Republic | 89,722 | Czech Republic | 81,991 |
| 7. | Belarus | 78,597 | Kazakhstan | 65,063 |
| 8. | Kazakhstan | 66,149 | Belarus | 55,442 |
| 9. | United Kingdom | 56,391 | United Kingdom | 47,911 |
| 10. | Romania | 49,831 | Lithuania | 47,085 |
| 11. | Other | 536,974 | Other | 493,421 |
Total revenue | 1,920,427 | Total revenue | 1,744,878 | |
For additional information, please contact:
Daniel Kordel, ASBISc Enterprises PLC, Investor Relations
Tel. +357 99 633 793
Tel. +48 509 020 021
E-mail d.kordel@asbis.com
Costas Tziamalis, ASBISc Enterprises PLC, Investor Relations
Tel. +357 25 857 000
E-mail costas@asbis.com
Iwona Mojsiuszko, M+G
Tel. +48 22 625 71 40
Tel. +48 501 183 386
E-mail iwona.mojsiuszko@mplusg.com.pl
ASBISc Enterprises Plc is based in Cyprus and specializes in the distribution of computer hardware and software, mobile solutions, IT components and peripherals, and a wide range of IT products and digital equipment. Established in 1990, the Company has a presence in Central and Eastern Europe, the Baltic States, the former Soviet Union, the Middle East, and North Africa, selling to 75 countries worldwide. The Group distributes products of many vendors, manufacturers and sells private-label products: Prestigio smartphones, tablet PCs, external storage, leather-coated USB accessories, GPS devices, Car-DVRs, MultiBoards etc. and Canyon (MP3 players, networking products and other peripheral devices). ASBIS has subsidiaries in 26 countries, more than 1,700 employees and 32,000 customers. The Company’s stock has been listed on the Warsaw Stock Exchange since October 2007 under the ticker symbol “ASB” (ASBIS).
For more information, visit the company’s website at www.asbis.com or investor.asbis.com


