WHERE TO BUY
ASBIS supplies a wide range of IT products to its customers all over UAE. To find out retail store near you visit ASBIS Resellers section
Other headlines

ASBIS in Q4 2010: Strong Increase in Revenues Indicates Bright Future
USD 477M revenues and USD 1.9M net profit in Q4 allowed to regain profitability in 2010 and produce forecasts for 2011

USD 477M revenues and USD 1.9M net profit in Q4 allowed to regain profitability in 2010 and produce forecasts for 2011
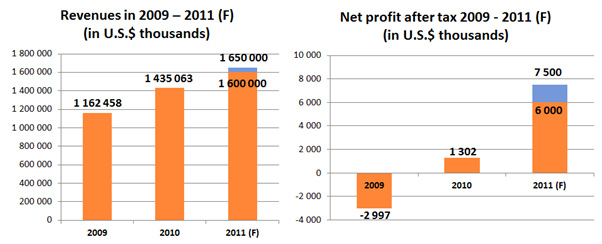
Limassol, 23rd February 2011 – ASBISc Enterprises Plc, a leading distributor of IT products in emerging markets of Europe, Middle East and Africa, posted revenues of USD 477 million for the fourth quarter of 2010, 16.44% higher than in Q4 2009. Gross profit grew by 19.56% before and 10.87% after currency movements. Growth in revenues and net profit in Q4 2010 allowed the Company to close 2010 with revenues of U.S.$ 1. 435 billion, 23.45% higher compared to U.S.$ 1.162 billion in 2009 and net profit of U.S.$ 1.3 million compared to net loss of U.S.$ 2.99 million in 2009.
These results allow the Company to think bright about the future and publish official financial forecasts. ASBISc expects to have revenues of U.S.$ 1.6 billion to 1.65 billion in 2011 - from 11,49% to 14,98% higher than in 2010. Net profit is expected to reach from U.S.$ 6 million to U.S.$ 7.5 million – about five to six times higher than in 2010.
“This was another quarter with much increased sales arising from stronger market position. As a result, quarterly revenues grew by 16.44% and annual revenues by 23.45%. Despite the fact that our hedging actions saved roughly U.S.$ 850 thousand, the Company was hit with FX losses of U.S.$ 1.6 million.. However, we have faced lower gross profit margins on some big product lines and significant increase in selling expenses. As a result profit from operations in Q4 2010 amounted to U.S.$ 4.5 million – less than we expected. Although for the whole 2010 it amounted to U.S.$ 9,429, almost four times higher than in 2009, we have already taken actions, including further rebuild of portfolio and focus on sales of products with better margins i.e. own brands and A-branded goods, investments in the most profitable lines, as well as optimization of expenses. With our strong market position and good demand observed in our main markets, we are committed that the future is bright.” - commented Siarhei Kostevitch, CEO and Chairman of ASBISc Enterprises Plc.
FINANCIAL RESULTS IN Q4 2010 AND Y2010
In USD thousands | Q4 2010 | Q4 2009 | Change | 2010 | 2009 | Change |
Revenues | 477,069 | 409,714 | +16.44% | 1,435,063 | 1,16 2 , 458 | +23.45% |
Gross profit before currency movements | 23,507 | 19,661 | +19.56% | 70,103 | 56 , 894 | +23.22% |
Currency movements on gross profit | (1,698) | 9 | N/A | (3,74 4 ) | (3 , 937) | -4.90% |
Gross profit after currency movements | 21,809 | 19,671 | +10.87% | 66,360 | 52,957 | +25.31% |
Gross profit margin before currency movements | 4.93% | 4.80% | +2.71% | 4.89% | 4.89% | 0% |
Gross profit margin after currency movements | 4.57% | 4.80% | -4.79% | 4.62% | 4.56% | +1.32% |
Administrative expenses | (6 , 435) | (6,189) | +3.99% | (23,466) | (22,404) | +4.74% |
Selling expenses | (10,843) | (8,386) | +29.31% | (33,464) | (27,664) | +20.97% |
Operating profit | 4,530 | 5,096 | -11.11% | 9,429 | 2,889 | +226.38% |
EBITDA | 5,328 | 5,851 | -8.94% | 12,439 | 5,786 | +114.99% |
Net profit | 1,914 | 2,413 | -20.68% | 1,302 | (2,997) | N/A |
Summary of growth trend:
- Significant growth in revenues: + 16.44% in Q4 and +23.45% in 2010 , mostly because of stronger market position and better demand in main markets .
- Improved gross profit both before and after currency movements: Gross profit before currency movements in Q 4 2010 increased by + 19 . 56 % to U.S.$ 23 , 507 from U.S.$ 1 9 , 661 in the corresponding period of 2009 ; for the whole 2010 it grew by 23.22% to U.S.$ 70.103 compared to U.S.$ 56.894 in 2009.
- Gross profit after currency movements in Q4 2010 grew by + 10 . 87 % to U.S.$ 21 , 809 from U.S.$ 1 9 , 671 in the corresponding period of 2009 ; for the whole of 2010 it grew by 25.31% to U.S.$ 66.360 from U.S.$ 52.957 in 2009.
- Strong growth in operating profit of 2010 : Although in Q4 2010 operating profit decreased by 11%, for a whole year it grew almost four times to U.S.$ 9 . 429 in 20 10 from U.S.$ 2 . 889 in 20 09 .
- Profitable again: After generating U.S.$ 1,914 of net profit in Q4 2010, the Company returned to profitability for the whole year, closing it with net profit after tax of U.S.$ 1,302 compared to a loss of U.S.$ 2,997 in 2009.
FINANCIAL FORECASTS FOR 2011

“This is the first time we publish an official financial forecast. Therefore, we prepared it as conservative as we could under the assumption that there will be no double dip in the economy. The Company forecasted its 2011 revenue to grow between +11.49% and +14.98% and net profit to increase between +360.83% and +476.04%. This clearly confirms that the Company is after the crisis times. This is especially possible because of expected growth trend in demand in the Company's markets and the assumption of further efficiency of our FX hedging teams.” - commented Marios Christou, CFO and Director of ASBISc Enterprises Plc.
DETAILED INFORMATION ON SALES PROFILE
Traditionally and throughout the Company's operation, the region contributing the majority of revenues has been the Former Soviet Union. This changed temporarily in 2009, when Central and Eastern Europe region was less affected by the world's financial crisis. However together with recovery of big markets like Russia and Ukraine, F.S.U. regained the first position in the Company's structure of revenues in 2010. This was also the case of Q4 2010 when revenues derived in F.S.U. countries grew by +40.58% compared to the corresponding period of 2009.
Additionally ASBISc' revenues in the Central and Eastern Europe grew by +6.41% and in the Middle East by +8.20%. On the other hand , sales in Western Europe dropped by 29.76% because of the Company's focus on its core markets.
„F.S.U. was the region where we suffered the most in the past, but with all our efforts to build up our position there, we benefited from growing demand in 2010. This was especially the case of Russia, where in Q4 2010 our sales grew by +43.09% and Ukraine with +10.44%. What is more important, we also grew in other regions and countries including +20.5% growth in Czech Republic. It is also important to underline the constantly growing importance of the Middle East for our results. In Q4 2010 and whole 2010 we grew there significantly again. It shall pay off in 2011 when we plan to grow more than 10% in revenues and five to six times in net profit” - commented Siarhei Kostevitch, CEO and Chairman of ASBISc Enterprises Plc.
REVENUE BREAKDOWN BY REGIONS IN Q4 2010 AND Q4 2009 (in USD thousands):
Region | Q4 2010 | Q4 2009 | 2010 | 2009 |
Former Soviet Union | 214,334 | 152,467 | 588,379 | 372,574 |
Central and Eastern Europe and Baltic States | 166,701 | 156,663 | 481,963 | 457,844 |
Middle East and Africa | 55,700 | 38,411 | 203,452 | 182,897 |
Western Europe | 26,980 | 51,480 | 109,926 | 110,974 |
Other | 13,355 | 10,693 | 51,343 | 38,169 |
Grand Total | 477,069 | 409,714 | 1,435,063 | 1,162,458 |
REVENUE BREAKDOWN IN Q 4 2010 AND Q 4 2009 - TOP 10 COUNTRIES (in USD thousands)
| Q4 2010 | Q4 2009 | ||
| Country | Sales | Country | Sales |
1. | Russia | 120,292 | Russia | 84,037 |
2. | Slovakia | 54,387 | Slovakia | 59,421 |
3. | Ukraine | 51,904 | Ukraine | 46,997 |
4. | Czech Republic | 26,011 | United Arab Emirates | 22,283 |
5. | Belarus | 25,593 | Czech Republic | 21,585 |
6. | United Arab Emirates | 21,153 | Belarus | 16,088 |
7. | Saudi Arabia | 15,407 | Germany | 12,972 |
8. | Kazakhstan | 14,603 | Bulgaria | 11,340 |
9. | Bulgaria | 12,039 | Romania | 10,467 |
10. | Romania | 10,464 | Croatia | 9,781 |
11. | Other | 125,257 | Other | 114,744 |
| Grand total | 477,069 | Grand total | 409,714 |
For additional information, please contact:
Mr Daniel Kordel , ASBISc Enterprises PLC, Investor Relations
Tel. +00 357 99 633 793
Tel. +48 509 020 021
E-mail: d.kordel@asbis.com
Mr Costas Tziamalis , ASBISc Enterprises PLC, Investor Relations
Tel. +00 357 25 857 000
E-mail costas@asbis.com
Mrs. Iwona Mojsiuszko , M+G
Tel. +48 22 625 71 40,
Tel. +48 501 183 386
E-mail: iwona.mojsiuszko@mplusg.com.pl
ASBISc Enterprises Plc is based in Cyprus and specializes in the distribution of computer hardware and software, mobile solutions, IT components and peripherals, and a wide range of IT products and digital equipment. Established in 1990, the Company has a presence in Central and Eastern Europe, the Baltic States, the former Soviet Union, the Middle East, and North Africa, selling to 75 countries worldwide.
The Group distributes products of many vendors and manufactures and sells private-label products: Prestigio (external storage, leather-coated USB accessories, GPS devices, etc.) and Canyon (MP3 players, networking products and other peripheral devices). ASBIS has subsidiaries in 26 countries, more than 1,000 employees and 32,000 customers. The Company's stock has been listed on the Warsaw Stock Exchange since October 2007 under the ticker symbol “ASB” (ASBIS).
For more information, visit also the company's website at www.asbis.com or investor.asbis.com.


